Disclaimer
EzOrderFlow is a descriptive product. It shows public market data (order books, executed trades, liquidations, open interest, venue announcements) and derived views computed from them. It contains no trading signals, no recommendations, and no financial advice.
Only the liquidation zones are model output, and they are always labeled "estimated". Everything else draws what was recorded.
Data limits to know
- Bitget
fills-historycaps at 100 fills per call, so Trades/Prints are not offered for tail-tier coins; the cells would be silently partial. - Depth and aggregate-heat rows are 5-minute snapshots: a level that appeared and vanished inside one slot leaves no record.
- Band kinds (
depth,xdepth,prints,fp,liqs,oi) keep ~1 week hot before archiving. - Liquidations come from other venues' public feeds: a proxy for this market, not its complete set.
- Liq zones assume positions entered near the price at the moment OI rose; entry-price distribution is not directly observable.
Free to use. Charting library: TradingView Lightweight Charts™.
Metrics: what each panel computes
∿ Volume bars, Delta, CVD
Aggressive (taker) volume per candle, split buy/sell. History replays from our collector archive (Bitget taker-buy-sell rows, per-minute footprint cells on tracked symbols, and Binance kline taker split where the pair exists), summed over the selected venue set (default: all venues). Where no split was measured, the bar still paints the candle's total volume in its own direction (green on up, red on down): Delta adds nothing there, while CVD counts that volume by the inferred side.
Δi = Vibuy − Visell (0 when no split is measured)
CVDi = Σj≤i Δj, with unsplit candles counted as +V/−V by direction
≡ Depth
Live order-book histogram beside the price axis. The book buckets into rows at a configurable price step; each row sums resting quantity.
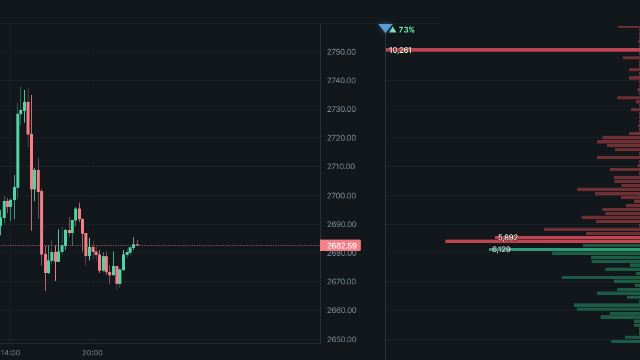
wall(b) ⟺ bucket(b) ≥ k · median(bucket), k = 3 by default
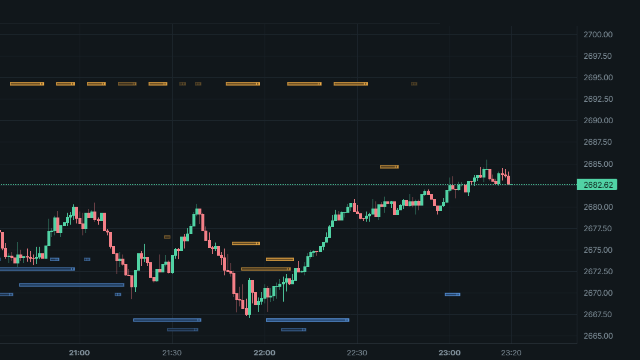
△ Walls
The Bitget wall lifecycle trail. Bands open at levels that qualify as walls (bucket ≥ threshold × median, top-percentile and minimum-size gates), persist while the level keeps resting, and close when a candle trades through the price or the level is pulled. Replays from recorded depth rows; a stored band only opens at wall grade (≥3× median).
▦ Heat
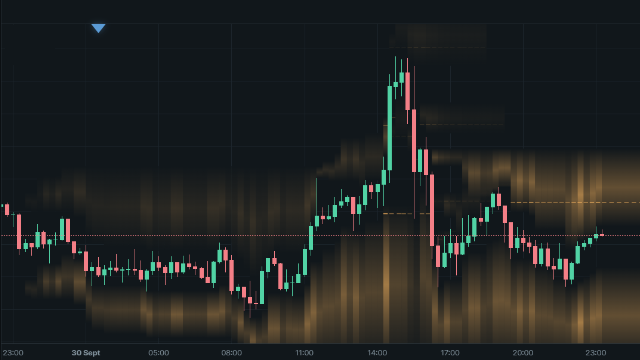
Cross-venue aggregate liquidity cloud. The collector merges book snapshots from all reporting venues per 5-minute slot into one aggregate book (levels beyond ±50% of the reference mid are dropped as implausible), bucketed at a fixed 0.05% step. Brightness is each level's share of the largest level that minute; stored Bitget depth rows fill slots the aggregate missed.
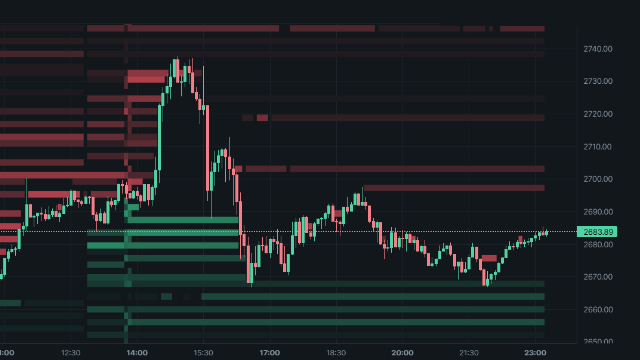
intensity(p) = bookagg(p) / maxp bookagg(p)
◉ Trades
Bubbles at (time, price) for large executed fills. Dense-tier sweep keeps fills ≥ $25k notional per venue, deduped by venue+trade id; the view then draws the top share of loaded dots (configurable, plus per-candle merge and minimum-size filters).
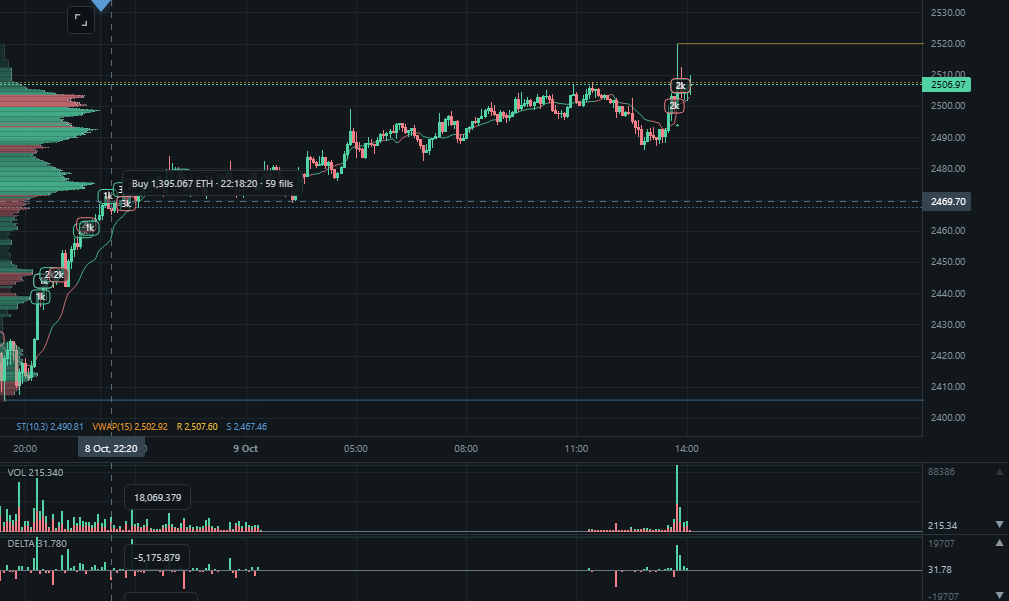
drawn ⟺ q ≥ top-% quantile of loaded dots
◫ Prints (footprint)
Per-price lanes inside each candle: every deduped fill aggregates into minute × price cells as {buy, sell}; cells tile into the candle they belong to. Stored fp rows cover history; the live trade stream owns the current minute (the boundary minute's stored tail is skipped to avoid double-counting).
▼ Liqs
Liquidation markers from public venue feeds: Binance forceOrder and Bybit allLiquidation live, OKX REST for recent history. Bitget exposes no public liquidation feed. Events in one candle slot and side merge into a single marker at the quantity-weighted price.
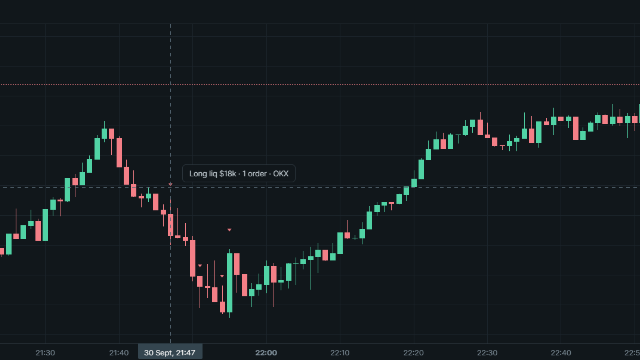
▨ Liq zones (estimated)
When open interest rises, the model treats the increase as new positions entered near that moment's price and maps them through standard leverage tiers: a 10x long liquidates ~10% below entry, a 50x ~2% below. Zones erode where later candles sweep through (wicks count) and die on a full cross ('sweep') or when OI drains the position set ('fade'). A single OI jump beyond 50% of the larger side is dropped as a data artifact; each drain event is floored at f ≥ 0.5.
zone dies ⟺ candle range crosses the band fully, or OI drains the mapped positions
◧ Imbalance zones
A candle births a zone when its displacement score clears a rarity gate; the zone spans the candle's range, projects forward, erodes as later candles trade back into it, and dies on a full cross. Demand zones sit below price, supply above.
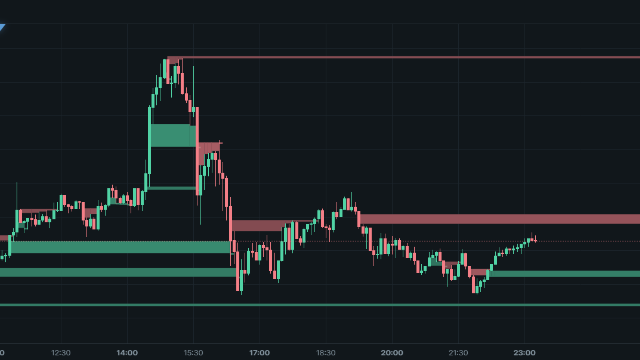
birth ⟺ score ≥ q95(recent scores) ∧ score ≥ 0.25
⚑ Events
Exchange announcements and scheduled events plotted as flags on the time axis. An LLM scores each headline's likely market-wide impact (plus a coin-scoped verdict); items awaiting a score render gray ("pending"). Listings and delistings come from the contract-universe diff.
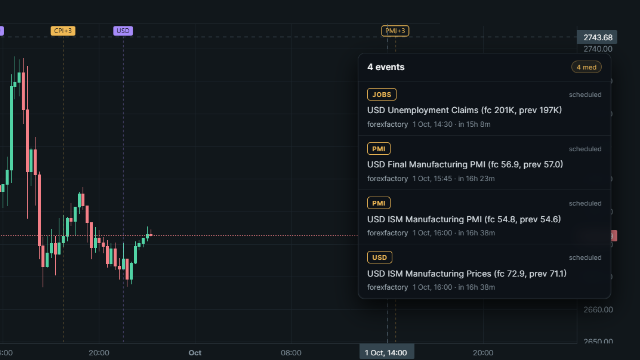
Γ Options levels
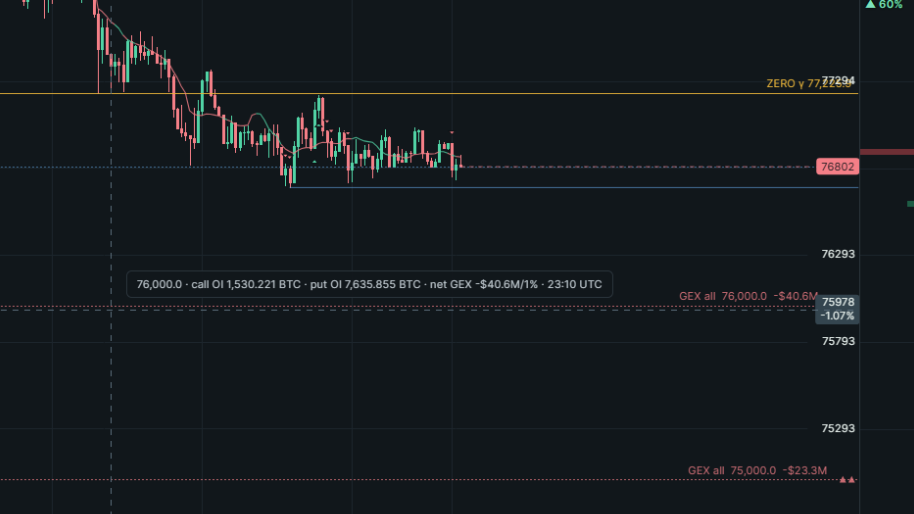
Strikes where option open interest and gamma concentrate across Deribit, OKX, Bybit, Binance, Paradex and Delta, merged every 5 minutes: green dashed lines = net positive GEX, red = net negative, amber = the zero-gamma flip; triangle count = strength. Toggle lives in ƒx Indicators → Options levels. Covers BTC, ETH, SOL, XRP, DOGE, BNB, HYPE.
stale venue > 2 sweeps old is excluded and listed, never silently blended
◇ Effort
How much volume each bar needed to move its range: filled diamonds ◆ mark absorbed bars (top-ranked effort, small displacement), hollow diamonds ◇ mark vacuum bars (thin effort, large displacement). Flags sit on the candles; hover one for the effort index, taker delta, OI and result breakdown.
absorbed: pct(eff) ≥ 90 ∧ pct(res) ≤ 35; vacuum: pct(eff) ≤ 10 ∧ pct(res) ≥ 95 ∧ res ≥ 15bps
Indicators: definitions and formulas
All indicators compute over the loaded candles only: close = C, high = H, low = L, open = O, volume = V, typical price TP = (H+L+C)/3, HHn/LLn = highest high / lowest low over n bars, pctw(x) = percentile rank of x against the last w bars, OI = open interest, Δ = taker delta (Vbuy − Vsell). Overlays draw on the price pane; the rest get their own pane. Defaults in brackets; line width and opacity exist on every indicator.
Overlays on the price pane
SMA [50]
Simple moving average of closes; one line per period entered.
n: the averaging window, in bars
Settings: Periods (comma list, one line each)
EMA [21, 50, 200]
Exponential moving average; reacts faster than SMA on the same length.
α: smoothing factor derived from n
Settings: Periods (comma list, one line each)
Bollinger Bands [20, ×2]
A mean band whose width follows close-price volatility.
σn: population stddev of closes over n; k: band width in sigmas
Settings: Period n, Multiplier k
VWAP [15 rolling, 0 = session]
Volume-weighted average price: where the average traded coin changed hands.
period > 0 rolls over n bars; 0 anchors at each UTC day
Settings: Period (0 = session), Candle-tint on/off
Supertrend [10, ×3]
ATR-based trailing band that flips direction when a close breaks through it.
m: ATR multiplier; a ratcheted band flips when a close crosses it
Settings: ATR period, Multiplier m
Parabolic SAR [0.02, 0.2]
Stop-and-reverse dots that trail the trend and accelerate on new extremes.
AF: acceleration factor, steps up per new extreme, capped at max; EP: extreme price
Settings: AF step, AF max
Ichimoku [9, 26, 52]
Japanese cloud system: fast/slow midlines, projected cloud, lagging close.
a, b, c: Tenkan, Kijun, Senkou B periods
Settings: Tenkan, Kijun, Senkou B periods
S/R levels [3 pivots, 30%]
One support and one resistance derived from the visible-window volume profile, snapped to nearby swing points.
then snapped to the nearest swing high/low on the correct side of price
Settings: Pivot bars, Volume quantile %
Swing points
Marks local highs/lows: the bars that extremes were printed on.
k: pivot lookback on each side
Settings: none beyond width/opacity
Options levels [GEX · all · 4]
Where option open interest and gamma concentrate across six venues (Deribit, OKX, Bybit, Binance, Paradex, Delta). Green dashed = net positive GEX, red = net negative, amber = zero-gamma flip; triangles count = level strength. Available on BTC, ETH, SOL, XRP, DOGE, BNB, HYPE: the tokens with listed options.
zero gamma: spot where ΣGEX crosses zero; walls: max call-OI / put-OI strikes
γ: Black-76 gamma from mark IV when the venue does not quote one
Settings: Source (GEX call−put / |GEX| / OI / volume), Expiry (all / 0dte / ≤1d / ≤7d / ≤31d / ≤91d), Levels (1–8), Zero-gamma on/off
Effort [100 · 90% · 15bp]
How much volume a bar needed to produce its move: filled ◆ marks absorbed bars (heavy effort, tiny displacement), hollow ◇ marks vacuum bars (tiny effort, big displacement). Diamonds anchor on the candle: ◆ above, ◇ below; red = sell-side effort, green = buy-side. Hover a flagged bar for the breakdown (EFF index, Δ, OI, result bps).
absorbed ⟺ pctw(eff) ≥ P ∧ pctw(res) ≤ (100−P)+25
vacuum ⟺ pctw(eff) ≤ 100−P ∧ pctw(res) ≥ 95 ∧ res ≥ floor
Settings: Rank window w, Flag pct P, Min move bps (vacuum floor)
Lower panes
RSI [14]
Wilder's relative strength index: momentum between 0 and 100.
Settings: Period
MACD [12, 26, 9]
Trend momentum from two EMAs: fast minus slow line, its averaged DEA line, histogram.
f, s, g: fast, slow, DEA periods
Settings: Fast, Slow, DEA
OBV + MA [30]
On-balance volume: cumulative signed volume, with a moving average on top.
Settings: MA period
Volume MA [5, 10]
Moving average of raw volume, drawn inside the volume pane.
Settings: Periods (comma list)
ATR [14]
Average true range: the bar's real size including gaps, in price units.
C′: previous close
Settings: Period
MFI [14]
Money flow index: RSI weighted by volume instead of close-only.
Settings: Period
KDJ [9, 3, 3]
Stochastic oscillator with the J line: where close sits inside the recent range.
sK, sD: smoothing periods
Settings: Period, sK, sD
StochRSI [14, 14, 3, 3]
Stochastic applied to RSI: sharper, mean-reverting oscillator.
Settings: RSI period, Stoch period, %K, %D
DMI / ADX [14]
Directional movement index: +DI/−DI measure sidedness, ADX measures trend strength.
sm: Wilder smoothing; DM: directional movement
Settings: Period
CCI [20]
Commodity channel index: deviation of typical price from its mean.
Settings: Period
Williams %R [14]
Where the close sits inside the recent high-low range, flipped to −100..0.
Settings: Period
BIAS [20]
Distance of the close from its moving average, in percent.
Settings: Period
Open interest
Total open interest across venues at 5-minute slots, from the collector pipeline.
Settings: none beyond width/opacity
Filter: the symbol screener
The symbol panel's Filters button opens the screener. Matches land in the Filtered tab; the other tabs are fixed views: All, Watching (your ★ list), Top rising and Falling by 24h change.
Market filters: last-24h tickers
| Filter | Reads |
|---|---|
| 24h move ≥ x % | Absolute 24h change in either direction |
| 24h volume ≥ $x M | USDT turnover over the last 24h |
| vs avg day ≥ x× | Today's 24h volume against that symbol's own daily baseline |
Candle filters: computed per symbol
| Filter | Reads |
|---|---|
| Price move over N bars | Net |Δ|, up-only or down-only percent move across the last N candles of the chosen timeframe |
| Volume spike ≥ x× avg | Recent N-bar volume against the per-bar average |
| MACD cross within N bars | DIF × DEA crossing, bullish / bearish / either |
| RSI(14) below / above level | Classic oversold / overbought gate |
| Scan depth: top N | How many top-volume symbols the candle filters fetch and test |
Candle filters only scan the top symbols by 24h volume; the scan-depth control bounds how deep the scan goes.
Settings reference
Every panel's settings live in its ⚙ block; all values persist per browser. Shared controls: opacity (peak transparency of the strongest element, weaker ones dim proportionally), price step (% of the visible range per bucket row; coarser merges levels, not just thickens lines), pane height and scale margin for lower panes.
| Panel | Setting | Default | Effect |
|---|---|---|---|
| Volume / Delta / CVD | Pane height, margin, CVD line width | 8%, 2.5%, 2px | Layout and autoscale padding of each lower pane |
| Volume profile | Resolution, split buy/sell | 48 rows | Price levels 12–1000; split stacks sell/buy inside each row |
| Depth | Bucket step, wall threshold | 1%, 3× | Row size; multiple of median liquidity that highlights a wall row |
| Trades | Trade size, per candle, candle share, min volume, merge range, backfill, max trades | top ~1%, 1, 10%, 5, 0.02%, 30 min, 300 | Which dots draw: top-% quantile (log slider), merge cap per candle, share of candle volume, absolute floor, merge cell width, history reach, density bound |
| Liqs | Min size | $10k | Notional floor for markers |
| Heat | Opacity, gap tolerance, price step, min rest | 45%, 6 min, 1%, off | Peak transparency; minutes a level may vanish before its band closes; band grain; minimum observed lifetime |
| Walls | Opacity, price step, top volume, depth reach, price gap, min cell, max cells/side, min rest | 50%, 1%, top 1%, ±0.5%, 0.1%, 25, 5, 2 min | Band grade gates: share of book shown, per-side depth, dead zone around price, absolute cell floor, per-candle cap, lifetime floor |
| Imbalance | Scope, rarity, absolute floor, opacity, max zones, history depth | global, top 5%, 25%, 30%, 80, 24h | Per-timeframe/symbol override scope; score quantile gate; junk floor; fill strength; zone count cap; how far back zones are built |
| Prints | Cell filters and lane controls | per panel | Per-price lane filtering and footprint density |
| Liq zones | Leverage band, window | standard tiers, ≤24h | How OI changes map to estimated liquidation bands |
| Panes | Pane order | flow → delta → cvd → indicators | Lower-pane stacking order; also via ▲▼ on each pane |
| Toolbar | Timeframe chips | 3+ picked | Quick-access chips; the rest stay under the ▾ menu |
| Options levels | Source, expiry, levels, zero-gamma | GEX · all · 4 · on | Ranking source (GEX/|GEX|/OI/volume), expiry window, top-N strikes, amber flip line |
| Effort | Rank window, flag pct, min move bps | 100, 90, 15 | Percentile lookback; effort-rank threshold; absolute bps floor for vacuum flags |
| Indicators | Per-indicator period(s), width, opacity | see Indicators tab | Each indicator exposes its own parameters, line width and opacity |
Datafeed contract
What lands on the server per collection tier, at what cadence, and how it ages out. Panel names follow the toolbar; kind names are the data/API vocabulary.
Top-50: dense tier (by 24h turnover, re-ranked hourly)
| Panel | Kind | Writer | Cadence | Hot | Archive | Bound |
|---|---|---|---|---|---|---|
| △ Walls + Depth history | depth | live-book + far-REST snapshot and REST round-robin | ~2 rows/5-min slot | 7d | gzip move | 365d |
| ▦ Heat | xdepth | xdepthSweep: all ~13 venues merged | every 5-min slot | 7d | gzip move | 365d |
| ◉ Trades | prints | warmSweep all venues, ≥$25k notional + 30-min backfill on tier entry | every 5-min sweep | 7d | gzip move | 365d |
| ◫ Prints | fp | fpAccumulate: every deduped fill → minute×price cells | sealed per minute | 7d | gzip move | 365d |
| Volume/Delta/CVD | flow | flowStep: Bitget taker + Binance kline split | ~once/5-min slot | 365d | gzip copy | 365d |
| Price marks | px | flowStep kline + warmSweep real-trade marks | ~5-min (per-minute inside sweeps) | 365d | gzip copy | 365d |
| ▼ Liqs | liqs | Binance+Bybit all-symbol streams, OKX 5-min poll | live events | 7d | gzip move | 365d |
| Zones/Imbalance feed | oi | warmSweep all venues + Bitget round-robin | 5-min slots | 7d | gzip move | 365d |
| n/a | funding | warmSweep per venue | every 5-min sweep | 7d | gzip move | 365d |
| n/a | ratios | warmSweep per venue | every 5-min sweep | 7d | gzip move | 365d |
| 24h turnover / Filter | volume | snapTickers: Bitget+Binance+Bybit | hourly | 365d | gzip copy | 365d |
| Γ Options levels | optlevels, optchain | optSweep: 6 option venues merged, 7 bases only | 5-min / hourly + settlement | 365d | gzip copy | 365d |
| ⚑ Events | news, newsq, newsout | adapters hourly/daily audit | hourly/daily | 365d | gzip copy | 365d |
| n/a | listings | contract-universe diff | hourly | 365d | gzip copy | 365d |
Others: sweep tier (every other contract, ~750)
| Panel | Kind | Writer | Cadence | Hot | Archive | Bound |
|---|---|---|---|---|---|---|
| △ Walls | depth | flowStep REST round-robin (Bitget only) | ~1 row/5-min slot | 7d | gzip move | 365d |
| ▦ Heat | xdepth | tail rotation: 1/12 of tail per slot, learned venue coverage | ~hourly | 7d | gzip move | 365d |
| ◉ Trades | prints | n/a | none today | n/a | n/a | n/a |
| ◫ Prints | fp | n/a | none today | n/a | n/a | n/a |
| Volume/Delta/CVD | flow | flowStep: Bitget taker + Binance kline split | ~once/5-min slot | 365d | gzip copy | 365d |
| Price marks | px | flowStep kline marks | ~5-min | 365d | gzip copy | 365d |
| ▼ Liqs | liqs | same venue-wide streams, identical coverage | live events | 7d | gzip move | 365d |
| Zones/Imbalance feed | oi | Bitget round-robin only | ~5-min | 7d | gzip move | 365d |
| n/a | funding, ratios | n/a | none | n/a | n/a | n/a |
| 24h turnover / Filter | volume | snapTickers | hourly | 365d | gzip copy | 365d |
| ⚑ Events | news, newsq, newsout | global _NEWS bucket | hourly/daily | 365d | gzip copy | 365d |
| n/a | listings | _universe diff | hourly | 365d | gzip copy | 365d |
Deferred: tail-coin Trades/Prints
Trades (prints kind): feasible, parked. One Bitget fills-history call inside the sweep for non-dense symbols, at a ~$100k tail floor. Caveat: the endpoint caps at 100 fills per call; a coin with more than 100 fills per 5 minutes loses the oldest fills in that window (thin coins unaffected).
Prints (fp kind): not honest, skipped. Footprint needs every fill; the 100-fill cap truncates silently, producing cells that understate volume.
Watchlist browser streams
The watchlist is unlimited and client-side only. One shared Bitget WebSocket in your browser carries the trade channel for up to 8 watchlisted symbols (the currently open symbol excluded; its slot frees for the next member). Fills buffer per symbol and replay through the standard ingest path when a symbol opens, so Trades dots and Prints cells arrive warm instead of empty. The server does no per-user collection.
Retention
flow, px, volume, news/newsq/newsout, listings: 365 days hot plus archive. Everything else (depth, xdepth, prints, fp, oi, liqs, walls, funding, ratios): 7 days hot, then gzipped into archive with a 365-day bound. A day-file is deleted only at retention+1 day, so archive always precedes delete.
Who we are
EzOrderFlow is a small independent project, free by design, built and maintained by Stanislav Fedorov. Therefore, "We" here really means me. However, I hope to grow a strong community around this project.
The idea grew out of my curiosity about how real markets and brokers actually work. Every serious tool I found sat behind a paywall, which felt hard to justify for a personal hobby. I figured there had to be a way to observe the same market data for free, and there was. What started as that experiment became the project you see here, fueled by interest and my own funds. As a researcher, I am inspired by Sci-Hub's success as well. So the idea is simple:
Tools that institutions take for granted should be available to everyone. This is the road to open market data.
The running server collects public market data around the clock and presents it descriptively: no trading signals, no financial advice, no accounts, no paid tiers. It is built for people who want to understand and play with the volume mechanics real market-makers use. I am not responsible for any risk you take based on the data shown on this site; all the data mechanics are documented on this page.
How it runs
- A single server collects public feeds from all watched venues into fixed collection tiers: density is a property of the pipeline, not of who is watching.
- Everything is free; running it costs money: server time, storage, domain, working time. A voluntary tip keeps the project online and developing.
- The roadmap lives on the landing page; this page documents only what already works. I hope you will see the features I want to introduce if everything works out.
For personal inquiries, collaboration offers, jobs, or interesting ideas, contact me at personal@ezorderflow.com.
I hope this grows into a strong community we can build together.
Report a bug or suggest a feature
Saw something broken, or have an idea that would make the tool better? Send it here. Reports are stored on the server and read by a human; nothing is posted publicly and nothing is passed to an AI.
Your browser type, the page you were on and your network address are stored with the report for abuse prevention. See the privacy notice.